
How to Reduce Customer Churn in Three Simple Steps: Part 1

Running your subscription business requires you to be hyper focused on Net Retention, which measures new business gained and existing business lost.
Regardless of whether we’re talking about dollars (often referred to as Net Revenue Retention) or customers (often referred to as Net Customer Retention), the fundamentals are the same: gain more than you lose.
While one strategy is to just grow the top line as fast as possible - which may work for a little while - a company will eventually run out of new customer opportunities and any customers lost along the way are, of course, very unlikely to come back.
In this three-part series, we’ll focus on how to effectively manage the lost customer / lost revenue side of the equation: customer churn.
Today, in Part 1, we’ll illustrate how Machine Learning can be used to quickly identify the reasons your customers churn. In the coming weeks we’ll show you how to forecast churn into the future in Part 2 and model the financial impact of resolving key trouble areas in Part 3.
Customer Sentiment vs Customer Churn
Traditionally, customer sentiment (whether measured as NPS, CSAT, or algorithmically) has been the go-to indicator for customer churn. Higher sentiment equals less churn, right? Well…sometimes! Since Everywhere evaluates both Natural Language sentiment and actual churn, we finally have that answer.

Customer Churn vs Customer Sentiment
In this case we can see that really lousy sentiment scores do, in fact, produce higher churn likelihoods. But as sentiment surpasses zero (neutral), we can see that churn likelihood starts to climb back up to the same level again. So watch out for the really angry customers…and the really happy ones?
The chart above highlights data from a B2B SaaS company, and while they don’t all look the same - some are flat as a table, some are S-shaped, and some do trend slightly down - these plots almost always have one thing in common: they are inconclusive.
At Everywhere, we use sentiment for various purposes, and it can be useful, but it’s not what we consider an outcome. It’s a soft metric and as such, it’s difficult to take action from it, at least from a customer retention perspective.
So what can we use to predict and resolve customer churn?
Using Machine Learning to Predict Churn
The challenge described above is why we use Machine Learning to model customer churn (and other outcomes), and use that output as our actionable metric. The vertical axis on the chart you just saw is from one of those models - it’s our platform’s statistical analysis on every customer’s likelihood to churn, based on customers who have actually churned.
What Causes Customer Churn?
There is no single answer here, of course, but we can offer our perspective based on what we see. We’ll use Everywhere’s automatic AI themes for this purpose.
For Direct to Consumer companies, the leading contributor to customer churn is often customers not receiving their order on time as shown in this example below.

Top Themes for Consumer Companies
Now, since essentially every sale has to be shipped to the customer, in many ways it’s not surprising that more subscribers who experience this problem are lost than any other category. This is where our Churn Likelihood metric comes in, as it evaluates the likelihood that any single customer will cancel their subscription.
Even though it’s the mathematical leading indicator, shipping/delivery is not the most highly correlated with churn. That distinction falls on customers having difficulty completing their orders, followed by customers who are unhappy with the product. Difficulty completing an order is what we’d call a low-hanging fruit!
For B2B Software companies, a popular use case for us, faster support is a leading churn indicator in this example, both in terms of volume and Churn Likelihood.

Top Drivers of Churn for B2B Companies
How Do You Reduce Churn TODAY?
In addition to uncovering the underlying reasons customers churn, Everywhere’s ML models are automated, impartial, and intelligent tools to assess what’s commonly called a “Customer Health Score.” By ingesting existing user data and conversations, it can automatically output any customer’s health score as it relates to the a specific outcome like churn, upgrades or renewals.
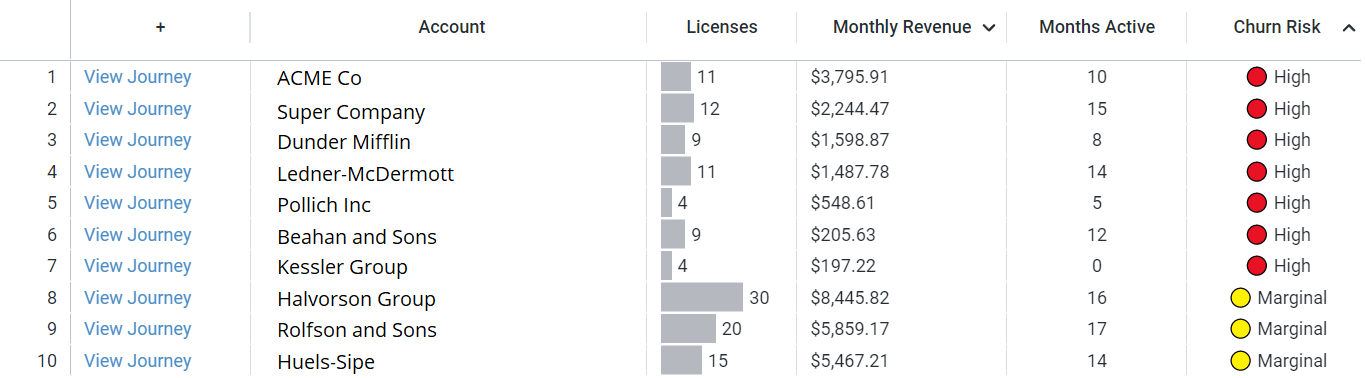
Accounts Sorted by Highest Churn Risk
Our users can then use this information to explore when and what has been called out by the model as high risk and resolve churn before it happens.

Explore Customer Churn Risk Journey with Everywhere
Reducing customer churn can be difficult…or quite easy with the right technology in place. To learn more about how Everywhere can help you reduce customer churn right now, drop us a line and we’ll get you started!