
Why Are You Losing Your Customers and Who Are You Going to Lose Next?

We’re not going to bury the lede here; the answer is Warranty claims. If you came here for that, read no further - fix your in-warranty reliability issues and the 22.4% of your customers who reach out for help processing a warranty claim will no longer have a reason to shop elsewhere.
Of course it is not quite as simple as that, and the data above is from our industry average for Consumer Products, but it’s a good place to start for any business. So for all of your who have made it this far, let’s dive into the details…and figure out why there’s a can of WD-40 at the top of this post.
Background
Why should you care about churn? Consider your Acquisition Costs and Lifetime Value for each of your customers, and it becomes pretty clear that retaining a customer, whenever possible, is preferable to churning out an existing one for a new one.
SupporTrends’ proprietary Churn Likelihood model digested just shy of 10 million (9,780,275 to be exact) customer support ticket sentences to help determine the driving factors which contribute most to customers leaving your brand.
This model is available as part of our usual subscription plans, and leans on the natural language used by customers who are known to have left a brand. We use Machine Learning to identify the common threads in their conversations so that we can:
Identify the most common factors in their choosing to leave
Identify current customers’ likelihood to do the same
Churn Likelihood Model
We use a measurement called Churn Likelihood to indicate whether a conversation is, overall, a match for our known churn profile. When a specific topic, phrase, or KPI shows, say, a 10% match, it tells us that the specific entity is a 10% match, or that it is used in 1 in 10 conversations with customers who left the brand. If an entity is a 100% match, it perfectly fits our known churn profile. This basically never happens in the real world though, for even a very simple term like “cancel subscription” does not result in a lost customer 100% of the time.
Why Are You Losing Your Customers?
Below is the output of two separate Machine Learning algorithms: one to match sentences with specific topics and another to match complete conversations against our known churn profile - Churn Likelihood. Here are the Top Ten factors for Consumer Products.

It’s important to note that SupporTrends’ Churn Likelihood model is not static; while the industry average for, say, Warranty Assistance, is a 28.7% match, that match is not the same for all companies (it ranges from around 10% up to the mid 30s). But on average, conversations that discuss warranty assistance are a 28.7% match for the known churn profile.
Moving on, we find Warranty Assistance close behind Registration Assistance, which we found quite fascinating. On one hand the pool is much smaller and perhaps less important (just 1.8% of total conversations focused on this topic), there’s no denying the coincidence that Registering for, and making a claim related to, a warranty occupy the top two spots on the chart.
Positions 3 through 10 are closer together, and cover product-related issues, pricing, and order issues for the most part. The data suggests that while these issues aren’t great, they are not as triggering as having to deal with a replacement product. Psychologically it makes sense, as customers have invested time and money into the product by that point, and during the exchange process (which may take days or weeks), they have nothing to show for it.
Personally, this is easy for me to relate to. Recently I purchased some clothing online from a company that has a good reputation for getting the clothes that fit correctly in the hands of their customers. In my case, one of the garments was too small, so I returned it in exchange for the next size up. By the time handling and transit both ways were factored in, it was one month to the day between the time I had paid for the product and the time I received one that fit. It was frustrating! And this wasn’t even a “warranty” issue, as there was nothing wrong with the product.
Who Are You Going to Lose Next?
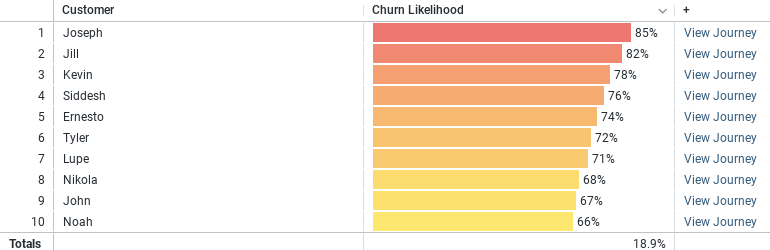
Joseph. You’re about to lose Joseph. To see how we arrive at that conclusion, we can apply our Churn models’ predictive capabilities. Since the models are trained on conversations with customers who have actually decided to shop elsewhere, these models are adept at evaluating customer conversations with current customers who are likely to shop elsewhere.
Along those lines, we can quickly discover a cohort of customers, a date range they purchased within, any specific demographics, or even the natural language themes and questions that they discussed.
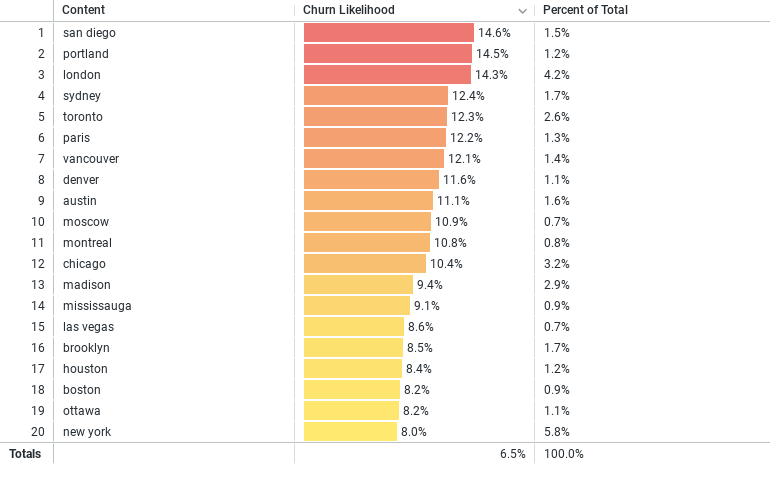
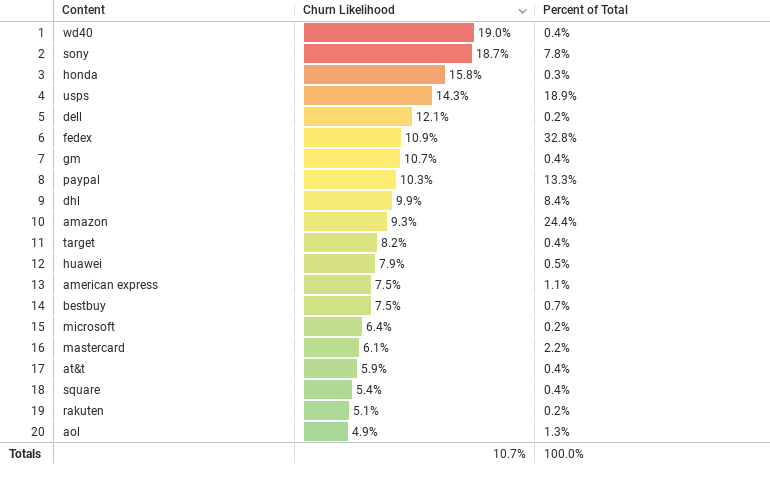
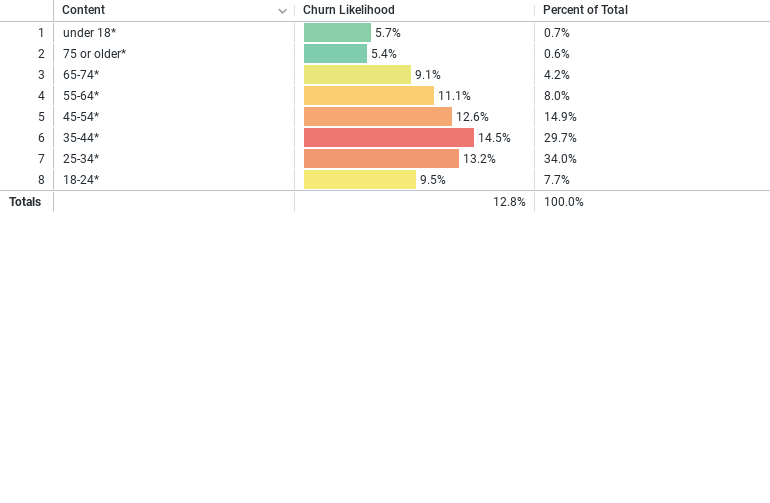
So in this sample, our 35 to 44 year-old customers from San Diego who discuss the use of WD-40 form the highest risk cohort. Filtering by these attributes produces a list of these ten people, sorted by overall churn likelihood.
So there you have it. A simple answer to a complex question, one that is made much more approachable by SupporTrends’ predictive churn modeling.
If you’d like to identify churn themes and reduce their effects within a matter of days, go ahead and let us know or sign up for your FREE trial of SupporTrends below.
Or you can schedule a quick demo to learn more about how SupporTrends can help!